Understanding the regulation, institutional framework, and demand and supply economics of natural gas is critical to assessing the issues that arise in disputes.
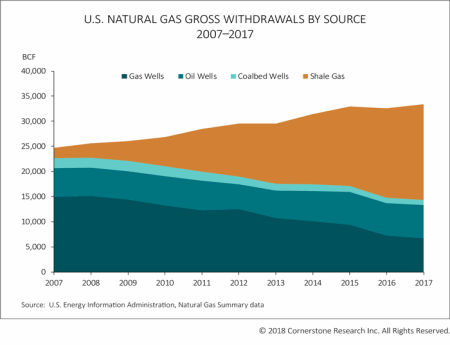
The production of U.S. natural gas has changed significantly over the last 15 years, driven by the development of shale gas technology. Shale natural gas production has grown to over 19,000 Bcf in 2017 while production from traditional sources such as gas wells, oil wells, and coalbed wells has fallen by approximately half that amount. The net effect has been an increase in annual total U.S. natural gas production by 40 percent in the last 15 years.
As a result of the increased production, natural gas prices in the United States have decreased. For example, the south Texas Houston Ship Channel (HSC) average annual price peaked at $8.45 per MMBtu in 2008 before decreasing to $2.94 per MMBtu in 2017. The decrease in prices has spurred growth in consumption and made exports from the United States more attractive to other countries.
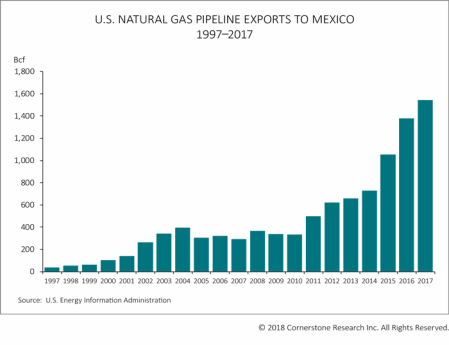
Importantly, exports from the United States to Mexico have increased 40 fold in the last two decades, driven largely by the growth in demand from the Mexican electricity sector and decreases in Mexico’s national production. Reflecting the transformation of market dynamics, price differentials have also changed: the southern Louisiana Henry Hub prices were roughly $0.30 per MMBtu greater than south Texas HSC prices during 2002–2009, but only $0.04 per MMBtu greater from 2010 to the present.i The increase of HSC prices relative to Henry Hub demonstrates the growing demand for hubs on pipelines closer to the Mexican border. Future price differentials may be further influenced by the increase in U.S. exports of liquefied natural gas (LNG), particularly from the Sabine Pass Terminal in Louisiana on the Gulf of Mexico, the largest U.S. LNG export terminal. Sabine Pass exports increased by over 40 percent from the first half of 2016 to the first half of 2017.
With these rapid transformations in the demand and supply economics of natural gas, critical analysis of market dynamics has become a key element in resolving natural gas disputes. Types of disputes may involve contractual price formulas, valuation of assets, supply agreements, and breach of contract. Cornerstone Research provides expert analysis and testimony for litigation (including commercial and investor state arbitrations), regulatory, and competition matters involving natural gas.
Growth in U.S. Natural Gas Exports to Mexico
- Between 2015 and 2017, U.S. exports of natural gas to Mexico via pipelines increased by 46 percent.
- In 2017, U.S. natural gas pipeline exports to Mexico comprised 49 percent of total U.S. natural gas exports, up from 29 percent in 2010.

Growth in Mexican Demand for Natural Gas
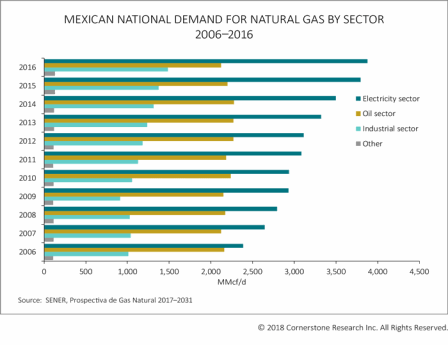
- Between 2006 and 2016, total Mexican demand for natural gas increased by over 30 percent while Mexican production decreased by 24 percent.
- The electricity sector was the major contributor to the growth in Mexican demand for natural gas, increasing its use of natural gas by 60 percent from 2006 to 2016.
- The rise in Mexican demand for natural gas, paired with lower domestic production, led to imports increasing by over 300 percent, much of it from the United States.

Growth in U.S. Natural Gas Transport to Mexico
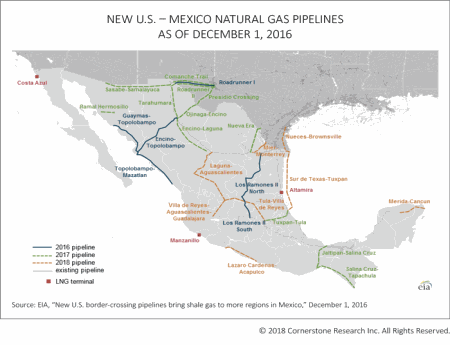
- From 2017-2019, the U.S. pipeline capacity into Mexico is expected to nearly double.ii
- In 2017, four U.S. pipeline projects began supplying natural gas to new natural-gas-fired electricity-generating power plants in the states of Chihuahua, Nuevo Leon, Sonora, and Sinaloa.
- By the end of 2018, two additional pipelines are projected to begin exporting natural gas to Mexico’s northeast and central regions, mainly from the Eagle Ford play in southern Texas.

Shifts in U.S. Natural Gas Production
- In the United States, natural gas production has shifted over the past decade from gas and oil wells to shale.
- Natural gas production from shale accounted for over 50 percent of annual natural gas production in 2017.iii
- The increase in shale production and subsequent cheaper U.S. natural gas is one of the main factors driving the expansion of cross-border pipeline capacity.

i Source: Bloomberg.
ii “New U.S. Border-Crossing Pipelines Bring Shale Gas to More Regions in Mexico,” U.S. Energy Information Administration, December 1, 2016, https://www.eia.gov/todayinenergy/detail.php?id=28972.
iii “Natural Gas Gross Withdrawals and Production,” U.S. Energy Information Administration, January 31, 2018, https://www.eia.gov/dnav/ng/ng_prod_sum_dc_NUS_mmcf_m.htm.